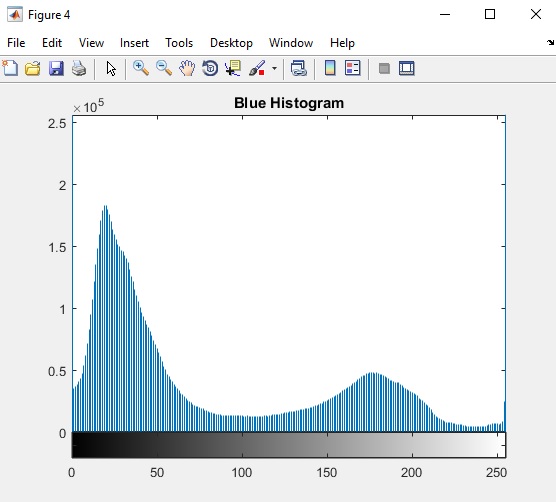
Segmenting is where Matlab determines whether or not a pixel value is high enough to meet a threshold. If it is, then the pixel is changed to white. If not, then the pixel is changed to black (there is no pixel values in between). The result is a stark black and white image. There are many ways to set the threshold. Aside from arbitrarily setting the threshold, Matlab can evaluate the intensity of the pixels in an image and their frequency, or often a pixel of that given intensity appears in the image. A graph of the frequency and intensity of pixels is called a histogram and looks like this.
A possible good pixel intensity value to use in segmenting the blue layer of this image is 100 because it forms a nice valley in the histogram. Using a threshold of 100 means the pixels responsible for the peak around 35 would appear black and the pixels responsible for the peak around 175 would appear white.
Matlab can go do better at picking a threshold that we can looking at a histogram. By calculating means and variances (standard deviations squared) of pixel values, Matlab can determine an optimal threshold level for an image layer. The method is called Otsu's Method and it finds a threshold that minimizes the variances within a segmented region and maximizes the variances between the segmented regions. In other words, it splits an image into regions where the the pixels within each black regions are as close together in intensity as possible and the pixels in a white regions are as close together in intensity as possible. At the same time, the intensity of pixels between the black regions and the white regions are as far apart as possible. You can see this is making the segmented image as stark in contrast as possible.
The Matlab command to find this magic threshold value looks like this.
[T, SM] = graythresh(image)
The input to this command is a two-dimensional array (a single color of an image) called image and the outputs are the optimal threshold value (T) and the separability measure (SM). Really, all one needs to segment an image after this command is the threshold value. Threshold (T) is a floating point number between 0 and 1. As a side note, SM is also a floating point number between 0 and 1 and the higher the value of SM, the better an image can be segmented.
Once the threshold value is known, the image is segmented using the following Matlab command.
segmentedImage = im2bw(image, threshold)
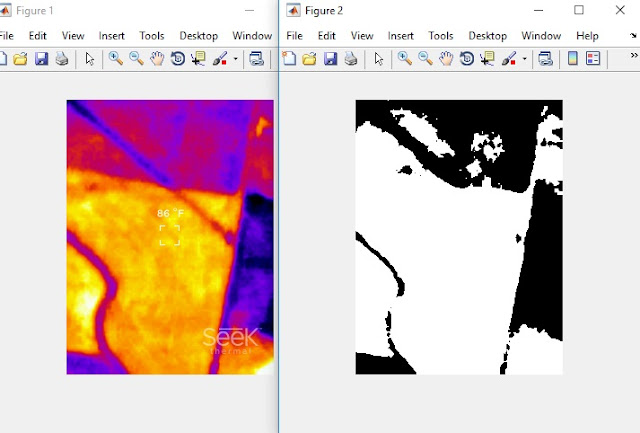 |
| On the left is the original thermal image taken during descent above Gypsum Creek near Newton, KS. On the right side is the segmented red layer extracted from this image. |
[edgedImage, threshold] = edge(image, 'canny', T, sigma)
The array edgedImage is the output of this command.
threshold is a vector (two dimensional array) that the Canny method uses to determine edges. It is not required and the EDGE command will calculate the value.
image is the input image.
'canny' is the method the EDGE command is to use
T is a threshold value passed to the EDGE command to use to find edges. This variable can be left blank and the EDGE command will determine the appropriate value. If left blank, the variable T will be set to threshold at the end of the calculation.
So when I ran this command, I set its values as follows.
[canny1, T1] = edge(imageLayer, 'canny', [ ], 1);
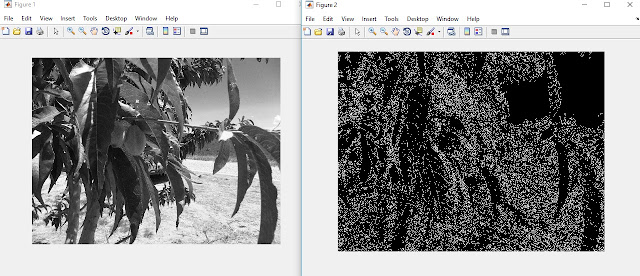
This may not be very useful in everyday images as you can see below.
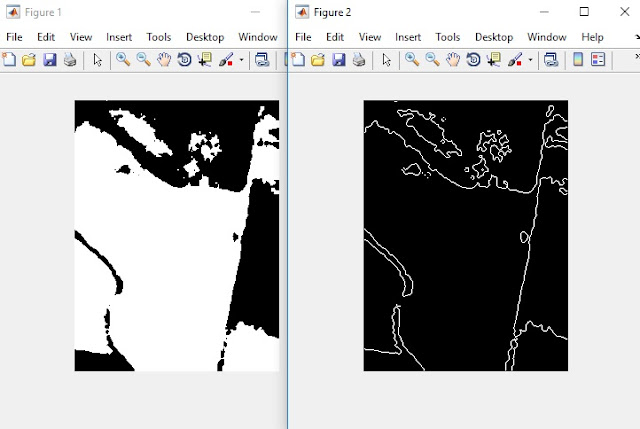 |
| The left image is the segmented red layer of the thermal picture. The right image is the edges detected in the segmented red layer. |
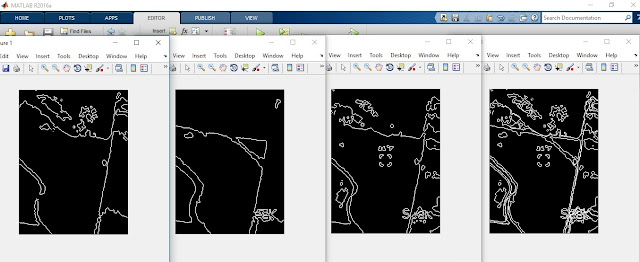 |
| From left to right, the images are edges in the red layer, edges in the green layer, edges in the blue layer, and the stacked image of all three layers. |
Finally, I created colored images from each layer and then concatenated them together. This turned out more difficult than I expected because each color's edge image is an array of logical values. In other words, each element in the arrays was either a 1 or 0. This creates two problems. First, the brightness of a pixel of value 0 or 1 are both very black (or close enough to black). Second, you can't concatenate three arrays of logical values. So the first step was to convert the logical array into an integer 8 array (so an array element, or pixel) could have a value of 255. I did this with the following command.
doubleRed = uint8(edgeSegmentedRed);
Then I multiplied each element in the integer 8 array by 255. This left the black pixels at zero and the colored pixel at 255. That command looks like this.
red255 = 255 * doubleRed;
After completing these steps for all three layers, I could concatenate them together with this command.
NewColor = cat(3,red255, green255, blue255); %restack or concateneate the images
It's important the order of the stacking be correct or else the product is an image where the individual layers are not shown in their proper color. when completed, the concatenation created the following picture.
 |
| The resulting image from edged segmented layers. |


No comments:
Post a Comment