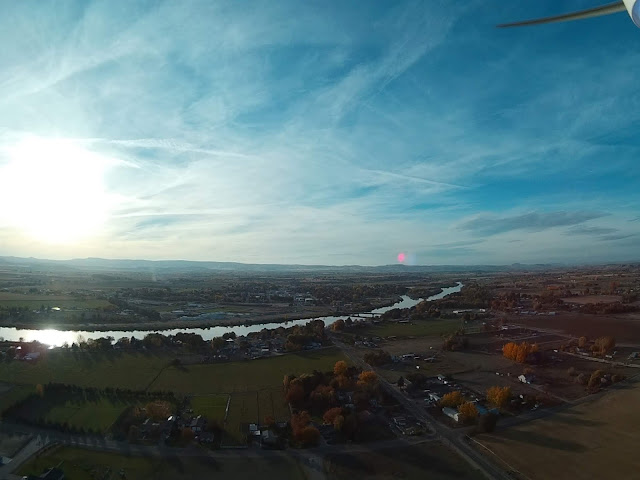
Wednesday, October 31, 2018

Weather for NearSys Station, October 2018

Here are the charts I created from the meteorological conditions measured at NearSys Station this continued

The ground temperature continued to decrease.

We're still dry. This month we only received one inch of rain over three rainy days.

During the middle of the month we were visited with a high pressure system.

The month didn't really get drier like I hoped.

The temperature continues to fall, except for a blip during the third week.

Monday, October 29, 2018

24-hour Temperature and Relative Humidity for NearSys Station, 29 October 2018

The Amprobe TR-200A collected data every minute for 24 hours beginning at midnight. Below is a graph of the results.


Sunday, October 28, 2018

24-hour UV-B Flux for NearSys Station, 28 October 2018

The UV-B photometer collected started collecting data at midnight for every five minutes. Below is the resulting chart. I need to check the photometer program and spreadsheet to make sure they are displaying data beginning at midnight.

The day was cloudy.


The Statistics of Black Beans

Black Bean Pod from my Garden

After I harvested the black beans from my garden, I thought it would be interesting to do a little statistical analysis with them.

I grew a total of six bean plants, picked 157 bean pods, and collected 525 beans. Their weight was 3.7 ounces and the volume 1/2 cups. This means black bean plants on average produced 26.16 pods each and 95.83 beans each. On average weigh, each bean weighs 0.18 grams.

The minimum number of beans per pod was zero and the maximum was seven. But not all possible numbers of beans per pod showed up equally.


The mean number (the average) of beans per pod pod was 3.66. The median number (the number appearing in the middle when the numbers are sorted in numerical order) was four. The mode (the number of beans of beans per pod appearing most often) was five.

So what did I learn? I produced 34 cents of black beans. I need to water more in order to produce an acceptable amount of black beans next year.


Saturday, October 27, 2018

UAVSonde Data for NearSys Station, 27 October 2018

The UAVSonde was launched at 17:30 MDT and data returned indicates that the visibility was just over 50 miles.

At the surface,
Temperature: 66.2 deg
Relative Humidity: 48.4%

At FL4:
Temperature: 64.2 deg
Relative Humidity: 48.7%

North

West

South

East

Tuesday, October 23, 2018

24-hour Temperature and Relative Humidity for NearSys Station, 22 October 2018

The Amprobe TR-200A datalogger recorded temperature and relative humidity data for 24 hours Monday. Below is a graph of the results. It can be seen the datalogger experienced condensation between 1:00 and 9:30 AM MDT.


Sunday, October 21, 2018

UAVSonde Data for NearSys Station, 21 October 2018

The UAVSonde was launched at 17:02 MDT today. Based on images returned, the visibility is around 20 miles.

Here are the conditions recorded.
At SFC
Temperature: 69.4 deg
Relative Humidity: 34.7%

At FL4
Temperature: 71.6 deg
Relative Humidity: 27.9%

East

North

South

West

Saturday, October 20, 2018

24-hour UV-B Data for NearSys Station, 20 October 2018

The UV-B Photometer began recording data at midnight, 20 October. Below is a chart of the data. Odd how the flyz remained so low until close to 11:00 AM. I was in class all day, so I don't know what conditions were like this morning.


Sunday, October 14, 2018

UAVSonde Data for NearSys Station, 14 October 2018

What a clear day! It's still a bit breezy and a little bit chilly, but the 14:25 MDT UAVSonde flight indicates very clear conditions. The visibility is in excess of 50 miles.

At the surface,
Temperature: 57.9 deg
Relative Humidity: 19.5%

At flight level 4,
Temperature: 51.9 deg
Relative Humidity: 19.0%

East

North

South

West

Measuring Precipitable Water in the Atmosphere

I learned that Forest Mims authored an article in the October 2011 (pages 1311 - 1319) issue of the Bulletin of the American Meteorological Society (BAMS). The article is on using an infrared thermometer to measure the total column of water vapor overhead (also known as preciptable water or PW). Since water vapor is a greenhouse gas, the more of it overhead, the warmer the sky temperature measured by the infrared thermometer.

So I decided last spring to try this out for myself with my Seek Reveal thermal imager and see what I get. If successful, then I could start recording the amount of water vapor overhead as part of my amatuer science activities. I could also experiment with measuring PW as changes in weather approached.

The only problem I encountered was finding a website were I could get the current PW value. A little searching turned up the Unisys weather website (http://weather.unisys.com/current-weather?source=4&plot=97&inv=0&t=cur). If I select the Precipitable Water channel, I was given a map of PW values across the US like the one below.


Now, there's some interpretation to get the PW value for a location. So I expected some variation in the data just due to reading a chart. There's a second source of variation that I learned about more recently. That's that the data is only updated every 12 hours at around 7:45 AM and PM my time. So any measurements taken away from those times will not be accurate.

I started collecting my data last April and changed my procedures to only record data at around 8:00 more recently. The data was loaded into a spreadsheet and graphed per the instructions in Mr. Mims' article. A best fit line that was exponential was added as a trendline and it's equation displayed on the chart. Below is what my raw data looks like.

The R-squared value or coefficient of regression of 58.7% was not as high as I hoped and it comes from the data points that are far away from the line of best fit. Since I know some of the variation comes from taking data at bad times, I decided to remove the outliers to see what I get. The edited data is displayed below.


The updated regression coefficient of 81.2% is much more acceptable. And the regression equation of PW = 1.1985*e^temp is not much different from the raw data equation.

This equation for inches of PW works for my Seek Reveal if the temperature is in units of degrees Fahrenheit. Other imagers will need to generate their own equation.

I plan to collect data for a year before I start using my imager to collect PW data. Then I plan to see how PW changes as rainy weather approaches.

Thanks Mr. Mims for letting know about your article.

24-hour Temperature and Relative Humidity for NearSys Station, 13 Ocotober 2018

We had condensation yesterday and then it became very windy. So the Amprobe TR-200A got damp and it's sunshield was blown over. That will explain the two odd features of yesterday's data.


Saturday, October 13, 2018

24-hour UV-B Photometer Data for NearSys Station, 13 October 2013

The AdaFruit UV-B sensor and PICAXE-08M collected data every five minutes beginning at midnight, 13 October 2018. Below is a graph of the data. It was a cloudless day and the data shows. I don't know why the data looks the way it does between 1:00 and 3:00 PM, I was running errands at the time. However, we had very strong winds this afternoon.

Tuesday, October 9, 2018

24-hour Temperature and Relative Humidity for NearSys Station, 8 October 2018

The Amprobe TR-200A datalogger was left outside in the backyard beneath it's sunshield for 24 hours. Below is the data it collected.

A crew working on our landscaping moved the datalogger and that account for the two large spikes seen in the chart.


Saturday, October 6, 2018

24-hour UV-B Flux for NearSys Station, 6 October 2018

The AdaFruit UV-B sensor collected the UV-B intensity every five minutes until nightfall (when the flux reaches zero). Below is the resulting chart. It's apparent that it was cloudy all morning.

UAVSonde for NearSys Station, 6 October 2018

The UAVSonde was sent aloft at 11:30 AM MDT and it collected the following data.

At the surface,
Temperature: 63.0 deg
Relative Humidity: 55.1%

At Flight Level 4,
Temperature: 51.9 deg
Relative Humidity: 73.3%

The large temperature difference makes me wonder if the datalogger did not have enough time to cool down before launch.

Since mountains west could be seen and very little of the Owyhee Mountain Range could be seen, the visibility was between 15 and 20 miles.

East

North

South

West

Wednesday, October 3, 2018

24-hour UV Flux for NearSys Station, 2 October 2018

I finally found time to fix a coding error in my UV-B flux sensor. So I plan to begin posting weekly reports again. Next, I'll find some time to troubleshoot the LED Photometer.

Data is collected for 24 hours beginning at midnight. Below is the data collected yesterday.